Hispanic/Latino

Share this story

How Big Tobacco Targets Hispanic/Latino Communities

What’s one of the most insidious ways to infiltrate a community? Gain favor for your deadly products by funding schools and children’s education. Big Tobacco financially supported primary and secondary schools, universities and colleges, and even scholarship programs for Hispanic/Latino communities to create the illusion that they’re supporting the future of the community.1 Big Tobacco lobbied and donated large amounts of money to the Hispanic Chamber of Commerce to oppose tobacco tax increases, trying to make elected officials their puppets.2

All this money from the tobacco industry is devastating to the health of Hispanic/Latino communities. Lung cancer is the leading cause of cancer deaths among Hispanic/Latino populations in California, and smoking causes 80-90 percent of lung cancer cases.34

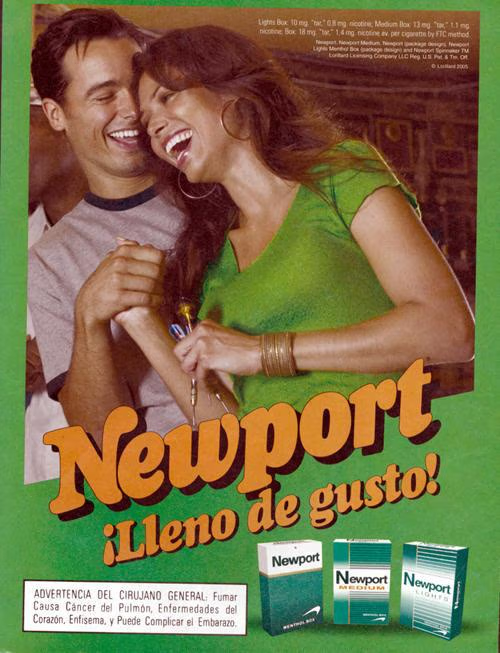
But Big Tobacco doesn’t stop there – the industry also aggressively discounts flavored cigar and cigarillos in predominantly Hispanic/Latino neighborhoods to hook new customers.4

Stay aware of Big Tobacco’s predatory tactics – they’re going to do everything they can to keep a deadly grip on Hispanic/Latino communities.

The proof is in the data

[Data last updated September 2024]
Indicator
Hispanic/Latino
General population
Adult tobacco use
Adult Cigarette Use: Adult cigarette smoking prevalence
5.9%
6.1%
California Health Interview Survey, 2021-22. Los Angeles, CA: UCLA Center for Health Policy Research.
Adult Cigarette Use: Adult cigarette smoking prevalence
5.9%
6.1%
California Health Interview Survey, 2021-22. Los Angeles, CA: UCLA Center for Health Policy Research.
Adult Cigarette Use: Adult cigarette smoking prevalence
5.9%
6.1%
California Health Interview Survey, 2021-22. Los Angeles, CA: UCLA Center for Health Policy Research.
Change in Adult Cigarette Use: Rate of change in adult cigarette smoking, 2014 to 2022
The 2022 estimate is significantly lower than the 2014 estimate.
-42.7%
-50.8%
California Health Interview Survey, 2021-22. Los Angeles, CA: UCLA Center for Health Policy Research.
California Health Interview Survey, 2013-14. Los Angeles, CA: UCLA Center for Health Policy Research.
Adult Tobacco Use: Adult tobacco use prevalence (e.g. cigarettes, e-cigarettes and other vaping products, other tobacco products)
11.1%
11.4%
California Health Interview Survey, 2021-22. Los Angeles, CA: UCLA Center for Health Policy Research.
Adult Tobacco Use: Adult tobacco use prevalence (e.g. cigarettes, e-cigarettes and other vaping products, other tobacco products)
11.1%
11.4%
California Health Interview Survey, 2021-22. Los Angeles, CA: UCLA Center for Health Policy Research.
Adult Tobacco Use: Adult tobacco use prevalence (e.g. cigarettes, e-cigarettes and other vaping products, other tobacco products)
11.1%
11.4%
California Health Interview Survey, 2021-22. Los Angeles, CA: UCLA Center for Health Policy Research.
Youth tobacco use
Youth Cigarette Use: Youth cigarette smoking prevalence
0.7%
1.2%
California Youth Tobacco Survey, 2023. RTI International.
Youth Cigarette Use: Youth cigarette smoking prevalence
0.7%
1.2%
California Youth Tobacco Survey, 2023. RTI International.
Youth Cigarette Use: Youth cigarette smoking prevalence
0.7%
1.2%
California Youth Tobacco Survey, 2023. RTI International.
Change in Youth Cigarette Use: Rate of change in youth cigarette smoking, 2016 to 2023
The estimate is significantly higher than the California general population.
-83.7%
-72.1%
California Youth Tobacco Survey, 2023. RTI International.
Change in Youth Cigarette Use: Rate of change in youth cigarette smoking, 2016 to 2023
The estimate is significantly higher than the California general population.
-83.7%
-72.1%
California Youth Tobacco Survey, 2023. RTI International.
Change in Youth Cigarette Use: Rate of change in youth cigarette smoking, 2016 to 2023
The estimate is significantly higher than the California general population.
-83.7%
-72.1%
California Youth Tobacco Survey, 2023. RTI International.
Youth Tobacco Use: Youth tobacco use prevalence (e.g. cigarettes, e-cigarettes and other vaping products, other tobacco products)
6.3%
7.3%
California Youth Tobacco Survey, 2023. RTI International.
Youth Tobacco Use: Youth tobacco use prevalence (e.g. cigarettes, e-cigarettes and other vaping products, other tobacco products)
6.3%
7.3%
California Youth Tobacco Survey, 2023. RTI International.
Youth Tobacco Use: Youth tobacco use prevalence (e.g. cigarettes, e-cigarettes and other vaping products, other tobacco products)
6.3%
7.3%
California Youth Tobacco Survey, 2023. RTI International.
Availability of tobacco & tobacco industry influence
Cheapest Cigarettes: Average price for the cheapest pack of cigarettes
$6.99
$7.11
Healthy Stores for a Healthy Community, 2019. Sacramento, CA: California Department of Public Health, California Tobacco Control Program.
American Community Survey, 2014-2018. Suitland, MD: U.S. Census Bureau.
Cheapest Cigarettes: Average price for the cheapest pack of cigarettes
$6.99
$7.11
Healthy Stores for a Healthy Community, 2019. Sacramento, CA: California Department of Public Health, California Tobacco Control Program.
American Community Survey, 2014-2018. Suitland, MD: U.S. Census Bureau.
Cheapest Cigarettes: Average price for the cheapest pack of cigarettes
$6.99
$7.11
Healthy Stores for a Healthy Community, 2019. Sacramento, CA: California Department of Public Health, California Tobacco Control Program.
American Community Survey, 2014-2018. Suitland, MD: U.S. Census Bureau.
Flavored Little Cigar Price: Average price for a single flavored little cigar/cigarillo
$0.91
$0.97
Healthy Stores for a Healthy Community, 2016. Sacramento, CA: California Department of Public Health, California Tobacco Control Program.
American Community Survey, 2011-2015. Suitland, MD: U.S. Census Bureau.
Tobacco Stores: Density of stores selling tobacco per 100,000 residents
The estimate is 10.0 stores per 100,000 higher than the California general population.
100.0
74.8
California Cigarette and Tobacco Products Retailer Licensees, March 29, 2024. Sacramento, CA: California Department of Tax and Fee Administration.
American Community Survey, 2018-2022. Suitland, MD: U.S. Census Bureau.
Flavored Tobacco: Proportion of stores that sell flavored non-cigarette tobacco products
83.2%
81.8%
Healthy Stores for a Healthy Community, 2019. Sacramento, CA: California Department of Public Health, California Tobacco Control Program.
American Community Survey, 2014-2018. Suitland, MD: U.S. Census Bureau.
Menthol Cigarettes: Proportion of stores that sell menthol cigarettes
90.5%
88.3%
Healthy Stores for a Healthy Community, 2019. Sacramento, CA: California Department of Public Health, California Tobacco Control Program.
American Community Survey, 2014-2018. Suitland, MD: U.S. Census Bureau.
Menthol Cigarettes: Proportion of stores that sell menthol cigarettes
90.5%
88.3%
Healthy Stores for a Healthy Community, 2019. Sacramento, CA: California Department of Public Health, California Tobacco Control Program.
American Community Survey, 2014-2018. Suitland, MD: U.S. Census Bureau.
Menthol Cigarettes: Proportion of stores that sell menthol cigarettes
90.5%
88.3%
Healthy Stores for a Healthy Community, 2019. Sacramento, CA: California Department of Public Health, California Tobacco Control Program.
American Community Survey, 2014-2018. Suitland, MD: U.S. Census Bureau.
Tobacco Advertising: Proportion of stores that keep 90% of their storefront free from any advertising
32.2%
40.1%
Healthy Stores for a Healthy Community, 2019. Sacramento, CA: California Department of Public Health, California Tobacco Control Program.
American Community Survey, 2014-2018. Suitland, MD: U.S. Census Bureau.
Secondhand smoke
Adult Secondhand Tobacco Exposure: Proportion of adults exposed to secondhand smoke or vape
25.1%
24.5%
California Health Interview Survey, 2021-22. Los Angeles, CA: UCLA Center for Health Policy Research.
Adult Secondhand Tobacco Exposure: Proportion of adults exposed to secondhand smoke or vape
25.1%
24.5%
California Health Interview Survey, 2021-22. Los Angeles, CA: UCLA Center for Health Policy Research.
Adult Secondhand Tobacco Exposure: Proportion of adults exposed to secondhand smoke or vape
25.1%
24.5%
California Health Interview Survey, 2021-22. Los Angeles, CA: UCLA Center for Health Policy Research.
Youth Secondhand Tobacco Exposure: Proportion of youth exposed to secondhand smoke or vape
The estimate is significantly lower than the California general population.
27.8%
32.9%
California Youth Tobacco Survey, 2023. RTI International.
Youth Secondhand Tobacco Exposure: Proportion of youth exposed to secondhand smoke or vape
The estimate is significantly lower than the California general population.
27.8%
32.9%
California Youth Tobacco Survey, 2023. RTI International.
Youth Secondhand Tobacco Exposure: Proportion of youth exposed to secondhand smoke or vape
The estimate is significantly lower than the California general population.
27.8%
32.9%
California Youth Tobacco Survey, 2023. RTI International.
Smokefree Homes: Proportion of adults with smokefree homes
91.9%
90.9%
California Health Interview Survey, 2021-22. Los Angeles, CA: UCLA Center for Health Policy Research.
Smokefree Homes: Proportion of adults with smokefree homes
91.9%
90.9%
California Health Interview Survey, 2021-22. Los Angeles, CA: UCLA Center for Health Policy Research.
Smokefree Homes: Proportion of adults with smokefree homes
91.9%
90.9%
California Health Interview Survey, 2021-22. Los Angeles, CA: UCLA Center for Health Policy Research.
Cessation
Quitting: Proportion of smokers who tried quitting in the last 12 months
The estimate is significantly higher than the California general population.
68.4%
57.9%
California Health Interview Survey, 2021-22. Los Angeles, CA: UCLA Center for Health Policy Research.
Quitting: Proportion of smokers who tried quitting in the last 12 months
The estimate is significantly higher than the California general population.
68.4%
57.9%
California Health Interview Survey, 2021-22. Los Angeles, CA: UCLA Center for Health Policy Research.
Quitting: Proportion of smokers who tried quitting in the last 12 months
The estimate is significantly higher than the California general population.
68.4%
57.9%
California Health Interview Survey, 2021-22. Los Angeles, CA: UCLA Center for Health Policy Research.
Doctor Advice to Quit: Proportion of smokers whose doctors advised them to quit
44.8%
49.1%
California Health Interview Survey, 2021-22. Los Angeles, CA: UCLA Center for Health Policy Research.
Doctor Advice to Quit: Proportion of smokers whose doctors advised them to quit
44.8%
49.1%
California Health Interview Survey, 2021-22. Los Angeles, CA: UCLA Center for Health Policy Research.
Doctor Advice to Quit: Proportion of smokers whose doctors advised them to quit
44.8%
49.1%
California Health Interview Survey, 2021-22. Los Angeles, CA: UCLA Center for Health Policy Research.
Kick It California
Percent of Enrollees
Percent of Smokers
Kick It California Enrollees: Proportion of Kick It California enrollees
The estimate is significantly lower than the population’s make-up of California’s adult smokers.
21.1%
36.0%
of smokers are Hispanic/Latino
California Smokers' Helpline Caller Intake Reports, 2020. San Diego, CA: California Smokers’ Helpline, University of California, San Diego.

How you can help

You have a voice and can make a difference.

SPEAK UP
Arrow right

A Story of Inequity

Tobacco’s impact on health disparities in California

For decades, the tobacco industry has aggressively targeted California’s diverse communities with predatory practices. Internal documents from Big Tobacco outline their strategies – many of which are shocking attempts to peddle deadly products by way of product discounts and manipulative advertising. They even gave away free products to youth in the past. These tactics masquerade as support for communities under the guise of cultural celebration.

Unfortunately, the tactics have worked. Big Tobacco aggressively targeted communities and, as a result, some populations have higher rates of tobacco use, experience greater secondhand smoke exposure at work and at home, and have higher rates of tobacco-related disease than the general population.5

Addressing tobacco-related health inequities is key to California’s efforts to fight tobacco, our state’s number one cause of preventable death and disease.6 Tobacco use, pricing, and its impact across California were analyzed where significant disparities were found across various populations. See how Big Tobacco affects each community in the Nation’s most diverse state.

A Story Of Inequity methodology >
story-of-inequity/hispanic-latino
UNDO logo
www.undo.org/
UNDO
UNDO fights Big Tobacco's deadly epidemic with bold campaigns for healthier California communities.
Facebook logoX iconMail iconWhatsapp iconCopy link
Link to section has been copied
Close